


At the planet’s most prestigious school, during an event designed to make sense of the most consequential upset in a year full of them, the world’s most prominent statistician admitted that his research and reporting, which millions of readers had turned to for reason during an unreasonable time, may have been open to misinterpretation.
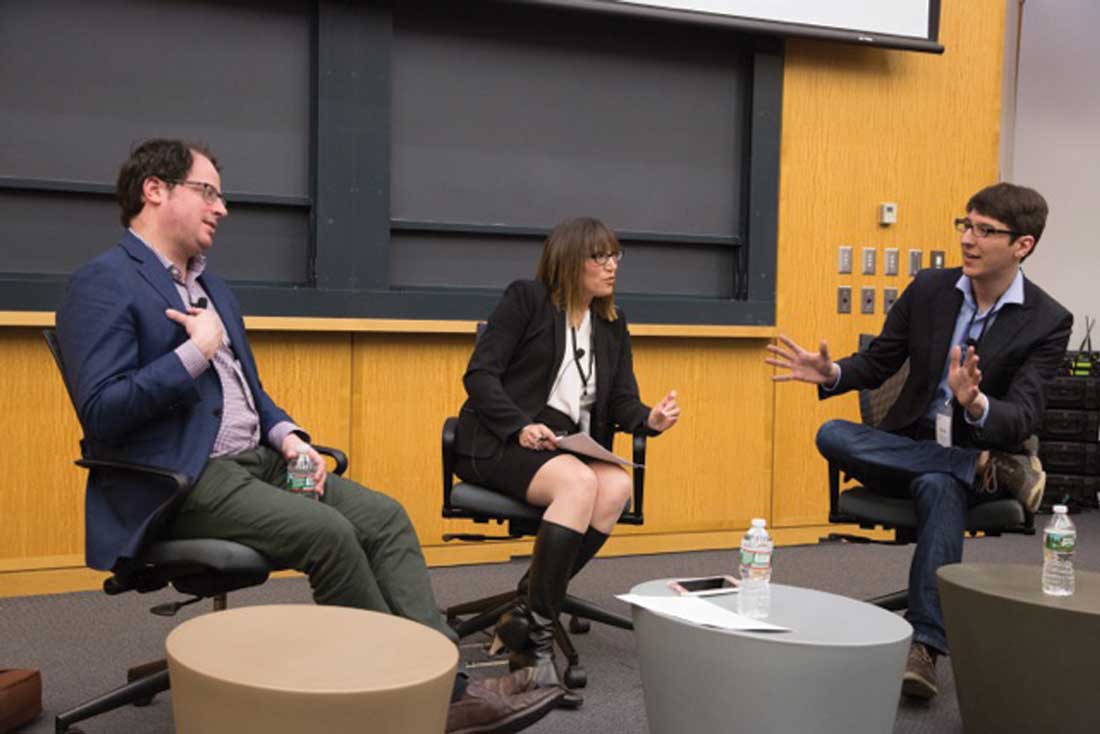
“It’s not intuitive, for people, to have numbers convey uncertainty,” said pioneering data journalist and FiveThirtyEight founder Nate Silver at Harvard’s second annual Political Analytics Conference.
Throughout the exhausting 2016 presidential race, millions followed the mathematical election forecasting popularized by Silver, whose previous precision had made him the darling of the political data world (and the sports world before that). Silver’s polling models correctly predicted the electoral outcomes of 49 states in the 2008 election, and in 2012 he called them all. So when his FiveThirtyEight formulas consistently showed Hillary Clinton as about a 3:1 favorite to defeat Donald Trump for most of the political season, onlookers took that to mean America’s first female presidency was all but a lock. As the headlines and Trump’s scandals became increasingly unpredictable, Silver’s metrics provided a degree of reassurance.

Until, of course, they didn’t.
With two weeks to go, Silver had Clinton at 86 percent likely to win, while his previous employers at The New York Times had the Democrat’s odds pegged at 93 percent. Her lead persisted in both until election night, when the Times had Clinton’s odds at 85 percent and FiveThirtyEight measured them to be 71 percent. When Donald Trump clinched his shocking Electoral College victory on November 8, those who had come to believe that the odds were impossibly against a President Trump were dumbfounded. Had the experts made a mistake, or was everyone mistaken to trust them?
Neither, to hear Silver tell it. The mistake that nonquantitative thinkers made, he argues, was presuming fate from a tool meant only to calculate likelihood. They misread the numbers they were looking at. As his Times counterpart Amanda Cox put it in describing her own election night model, “It’s really probability, not prophecy.”
 Bringing Moneyball to Politics
The Political Analytics Conference is the brainchild of Harvard University academics Ryan Enos and Kirk Goldsberry. Enos is a fellow and professor of government at the school, specializing in political psychology. Goldsberry is a former visiting scholar whose expertise in visual communication and spatial reasoning led him to a career in sports analytics. He began as a sports journalist, presenting innovative new ways of understanding basketball to readers at ESPN’s Grantland, before ascending to his current role as the vice president of strategic research for the San Antonio Spurs.
Sponsored by Harvard’s Institute for Quantitative Social Science and the Center for American Political Studies, the conference is modeled after MIT’s Sloan Sports Analytics Conference. What South by Southwest is to multimedia and Comic-Con is to Hollywood entertainment, Sloan is to the sports intelligentsia. Now in its 11th year, Sloan picks up where Michael Lewis’ Moneyball left off, using principles derived primarily from the economics world to push forward more sophisticated means of understanding and drive success in sports. Goldsberry said it was time that a deeper understanding of data finds its way beyond athletics and into the realm of politics and political discourse.
“We used Sloan as an inspiration in a way, because Sloan started as a very small conference at MIT … that blended media, practitioners, and academics,” he said.
If Sloan has helped to make sports smarter, Goldsberry has similar ambitions for Political Analytics, which he hopes can ultimately help heighten the understanding of the American electorate.
“In a weird way, sports is ahead of politics in using analytical reasoning to uncover, to explore, and to confirm ideas,” he said. “We want to provide a forum on an annual basis that brings together quantitative thinking and political discourse.”
One attendee is thrilled by the new event.
“I’ve been looking for something like this for the last couple of years,” said Travis Bunner, a data scientist with polling firm EMC Research who has attended both installments of the conference. “I respect what these guys are doing because there is nothing like this.”
Less singular was the topic of inquiry the conference pursued, which was the same as had been featured at innumerable symposiums since November, not to mention countless dinner-table discussions and barroom debates. Attendees sought to answer one overriding question: How had a fear-mongering reality TV star and purported real estate titan been elected the nation’s 45th president, and why hadn’t any of them seen it coming?
In the days since November, people have grasped for all kinds of explanations. By the readings of some, the election signaled that the nation’s gender biases were more intractable than its racial ones. Others saw race and racial identity as the deciding factors. Political operatives suggested a tactical failure. Some historians called it the inevitable result of ongoing demographic trends. The Harvard conference saw experts testify to all of these as causes of our national blindsiding, including a set of qualitative perspectives on how blind a person had to be to feel surprised.
The powers and dangers of microtargeting, the lines Google and Facebook draw between their user data and voter registration data, the role of forecasting, race, the way we disseminate political information overall — each was cited as a data point during the day’s expansive postmortem.
In hindsight, according to experts, it was the forecasting models that had given Clinton hopefuls what turned out to be a false sense of security. After years of advance polling bearing out in eventual elections, Silver suggested that the masses over-learned their lessons, saying, “People took 2012 to be the iron law of how politics works and I think came to some sophomoric conclusions because of that.”
Perhaps the group most guilty of misunderstanding, misinterpreting, or misrepresenting the data was the national media — some of whom were on hand for confession. Looking back to the 2012 election, when Mitt Romney’s camp insisted all the way up to the finish line that polling trends would prove to be incorrect, MSNBC journalist Steve Kornacki conceded that his on-air performance during this latest election night was shaped by a sense of certainty brought on by the leading indicators. “We all came in with a certain expectation [of] where things were likely to go … and the exit polls suggested that was probably where it was going to go,” he told the crowd of about 70 people.
In an industry that puts a huge premium on being first, it was suggested that part of what made reporters treat a Clinton victory as an inevitability was a fear of eventual embarrassment.
“I think the iconic moment from 2012 that hung over this entire election in the eyes of the media was Karl Rove, on the set of Fox News, saying, ‘It’s not over! They called it, but it’s not over!’ ” Kornacki said, describing the former Bush strategist’s 2012 election night struggle to accept the notion of a second Obama win. “Nobody wanted to be Karl Rove.”
For MTV News political columnist Ana Marie Cox, the election’s biggest surprise would be Trump’s ability to win over college-educated white women, despite his numerous public statements demeaning women and allegations of sexual misconduct.
“It’s one thing to know intellectually that something can happen,” Cox said. “It’s another thing to be able to internalize it and believe it’s a real thing.”
The Gap
Post-election, this perception gap has frequently been attributed to the idea of self-reinforcing “information bubbles,” largely shaped by interactions with social media. Robert D’Onofrio, Facebook director of data communications, was on hand in Cambridge to explain that while his company is intimately aware of the issue, there are limits to its willingness to restructure its platform to address diversity of opinion in the shared space.
“There’s a behavioral component to it that we can certainly influence, but we can’t change behavior,” D’Onofrio said. “Everyone has their own personal experience on Facebook, so we’re trying to take a product approach to it, letting the user control as much as possible about their experience.”
According to D’Onofrio, 128 million unique Americans discussed the election at some point on Facebook. Internal research shows that the most frequent topics of these conversations were crime and jobs. But as eager as Facebook is to celebrate the volume of the discussions it hosts, the social media giant is reluctant to publicly divulge much data regarding the sentiments expressed by its users, especially around issues as culturally divisive as this last presidential election. And while Facebook could remain nonpartisan about the sentiment of individuals, others were tasked with delving right into them.
Trump’s success has primarily been attributed to the emergent loyalty of the supposed “white working class.” According to pollster Matt Barreto, who has conducted extensive research into the minds of the electorate both before and after November’s contest through his opinion research firm Latino Decisions, the unifying principle held by Trump’s voter base was not rooted in financial concerns but rather in cultural ones.
Even after controlling for partisanship and ideology, “the most powerful explanatory variables for Trump,” Baretta said, “are the variables related to your views toward blacks, your views toward immigrants, and your views toward Muslims. In some cases, depending on how you build the model, the economic variables are flat. They are not more likely to predict a Trump or Hillary vote, at all.”
While its various factions might not have ultimately been aligned by economic outlook, one demographic made its influence known as a bloc in November.
“One of the ways to understand this election is to say that the white working class started voting like a minority group,” said veteran RealClearPolitics analyst Sean Trende, citing Trump’s 70 percent margin with such voters.
Before last year’s national election, Wisconsin public opinion pollster Kathy Cramer had seen firsthand her own state’s governor, Scott Walker, build a similar coalition around racial and economic resentment in small towns.
White working-class voters, she said, have been telling her “since 2007 that they are not getting their fair share of attention and respect and resources.”
In their minds, Cramer explained, the money they feel they deserve is going to “city” folks, a.k.a. minorities, allocated by politicians they see as unsympathetic to the needs of the white working class.
“The racial anxiety and the economic anxiety are inseparable, and maybe that’s always been the case in the United States,” Cramer said. “Our conversations about redistribution are about race whether we are willing to admit it or not.”
 Hurricane Donald

All these swirling complicating factors were explored during the conference’s competitive “hackathon” component, which saw teams composed of Harvard students, data science and visualization pros, and politicos coming together over a shared set of election data to try to extrapolate new and deeper insights. The winning team attempted to quantify the very anxieties that Cramer and Baretta described.
As explained by Harvard undergraduate Alexandra Abrahams, who presented the team’s findings, “We started out trying to answer the question of ‘To what extent did racial resentment motivate turnout in the 2016 election?’ ”
To calculate this, the group concocted a “racial conservatism” index, which tracked whether Obama voters had migrated to supporting Trump, cross-referencing their answers to racially charged questions like, “Do white people have advantages because of the color of their skin?” The findings weren’t conclusive, but a new model was built that could better judge that question as new data become available.
For Matt Lackey, a data expert with experience on Barack Obama’s 2008 campaign and with the AFL-CIO who now serves as vice president of research and development for the progressive big data firm Civis Analytics, the most dire issue facing American politics could be emerging concerns about the imperfection of survey research, which politicians rely on not only to win elections but also to shape policy. Citing the downtrend in response rates, Lackey expressed alarm that changing habits and interests make people less likely to answer telephone calls of unknown origins or spend upwards of a half-hour answering detailed questions about politics, all of which diminishes the well of data from which researchers divine insight.
“Non-response bias is a real problem,” Lackey said. “If we lose our ability to accurately measure what people think, we lose our ability to govern.”
To solve the challenges of a potentially ungovernable democracy, Americans will need to reconcile their discomfort with the differences between big numbers and sure things.
“People tend to underestimate the likelihood of relatively low-probability events,” said New York Times Upshot reporter Nate Cohn.
He continued, “Weather forecasters treat this problem way differently. … If you have a 5 percent chance that you’ll be hit by a hurricane tomorrow, you’re in a hurricane warning. The forecasters aren’t saying, ‘There’s a 95 percent chance that you won’t be hit by a hurricane.’ If Trump is a category five hurricane outcome, we should probably take shelter and be prepared for that.”
Many things considered, Washington Post political scientist John Sides warned against over-interpreting a single election. It was a pretty small sample size, after all.
“Had Clinton gotten about a percentage point more of the popular vote, she would have won the Electoral College, and we would have had a conversation about data and analytics that’s the exact polar opposite of the one we’re having now,” he said.
Even if they didn’t call a perfect game, analysts in this realm played a key role in the 2016 presidential election. As in professional sports, the influence of data cannot simply be measured by whether or not the ultimate victors had opted for analytically driven strategies. If the day had a persistent theme, it was that the low probability of a Trump victory and a misunderstanding of what that meant were perhaps the deciding factors that shaped the narrative around the campaign, which could have in turn dramatically affected the electorate.
At Harvard, the political analyst Sides couldn’t help but paraphrase another old, venerated institution.
“The real lesson from this election is that data and analytics are the worst way to run a campaign, except for all the other ways,” he said with resignation.
The truism held up to the scrutiny of a room full of data scientists, by any calculation or measurement. But if the Political Analytics Conference taught attendees anything, it was to be a little careful of looking backward when trying to think forward.
This story was originally published by the Boston Institute for Nonprofit Journalism.


Really helps if you did LOCAL electoral analysis…..